
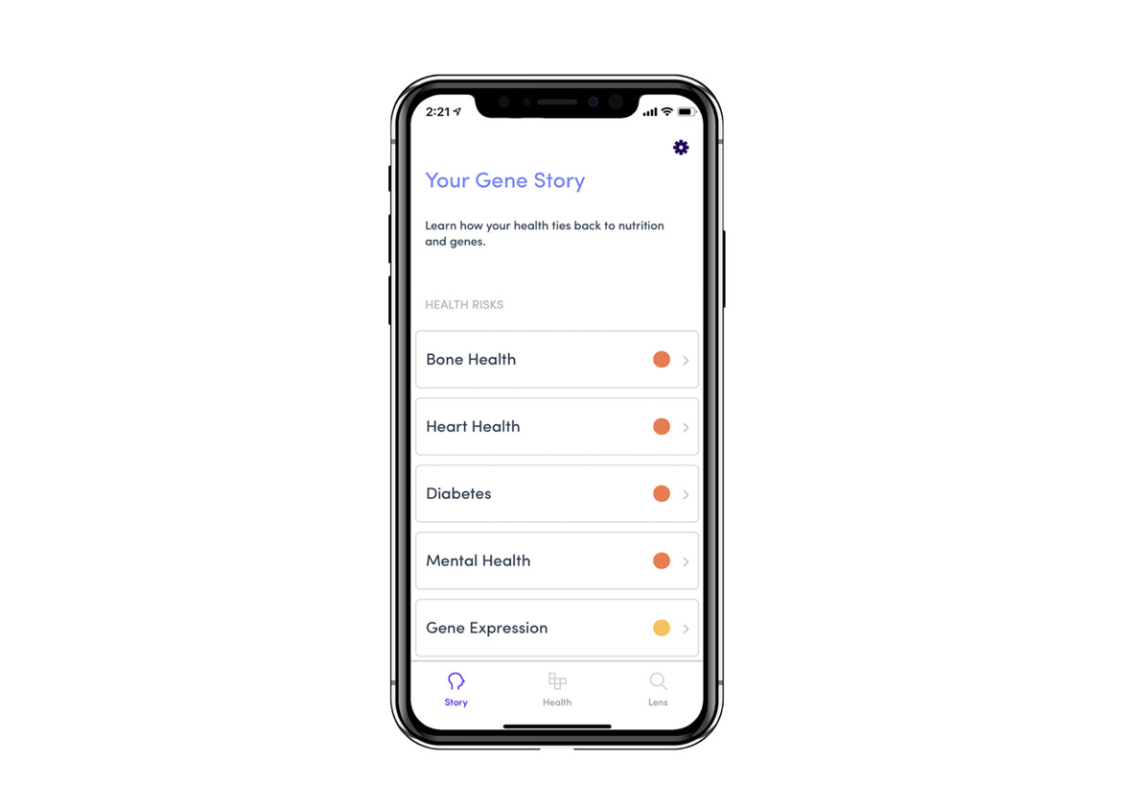
One of the questions we often get asked is how to make sense of the reports in gene stories. Each health risk, wellness, or trait has a colored indicator next to it to denote if the genetic risk is elevated, medium or normal. Diving into each of them enables you to understand what the responsible nutrient factors are and what foods you can target to negate the risk.
The science behind the reports
Before we get into what the colored dots mean and interpreting reports, it's important to understand how the reports are generated and the science behind Gini. When you upload your genetic data to Gini, we look for certain SNPs or single nucleotide polymorphisms that are present in your genes.
Depending upon your gene variant, your nutrient absorption may be impacted. Nutrients in turn are key for cell growth and optimal functioning of the body. If you become deficient in a certain nutrient, it elevates your chances of developing of a disease linked to that nutrient.
Colored dots and what they mean
Red, yellow and green dots are meant to highlight the gene-nutrient relationship for a given story. The red or yellow doesn’t predict that you will have that disease or condition. It just indicates that you have a genetic variant that may put you in high or medium risk of either being deficient of a particular micronutrient or impact the metabolization of a macronutrient. It’s not about if you have a disease, but rather the chances of your developing a health condition based on lifestyle factors if you don’t watch your nutritional requirements. Your risks are calculated based on nutrigenetics and nutrigenomics.
A Subchapter under heart health looks like this:
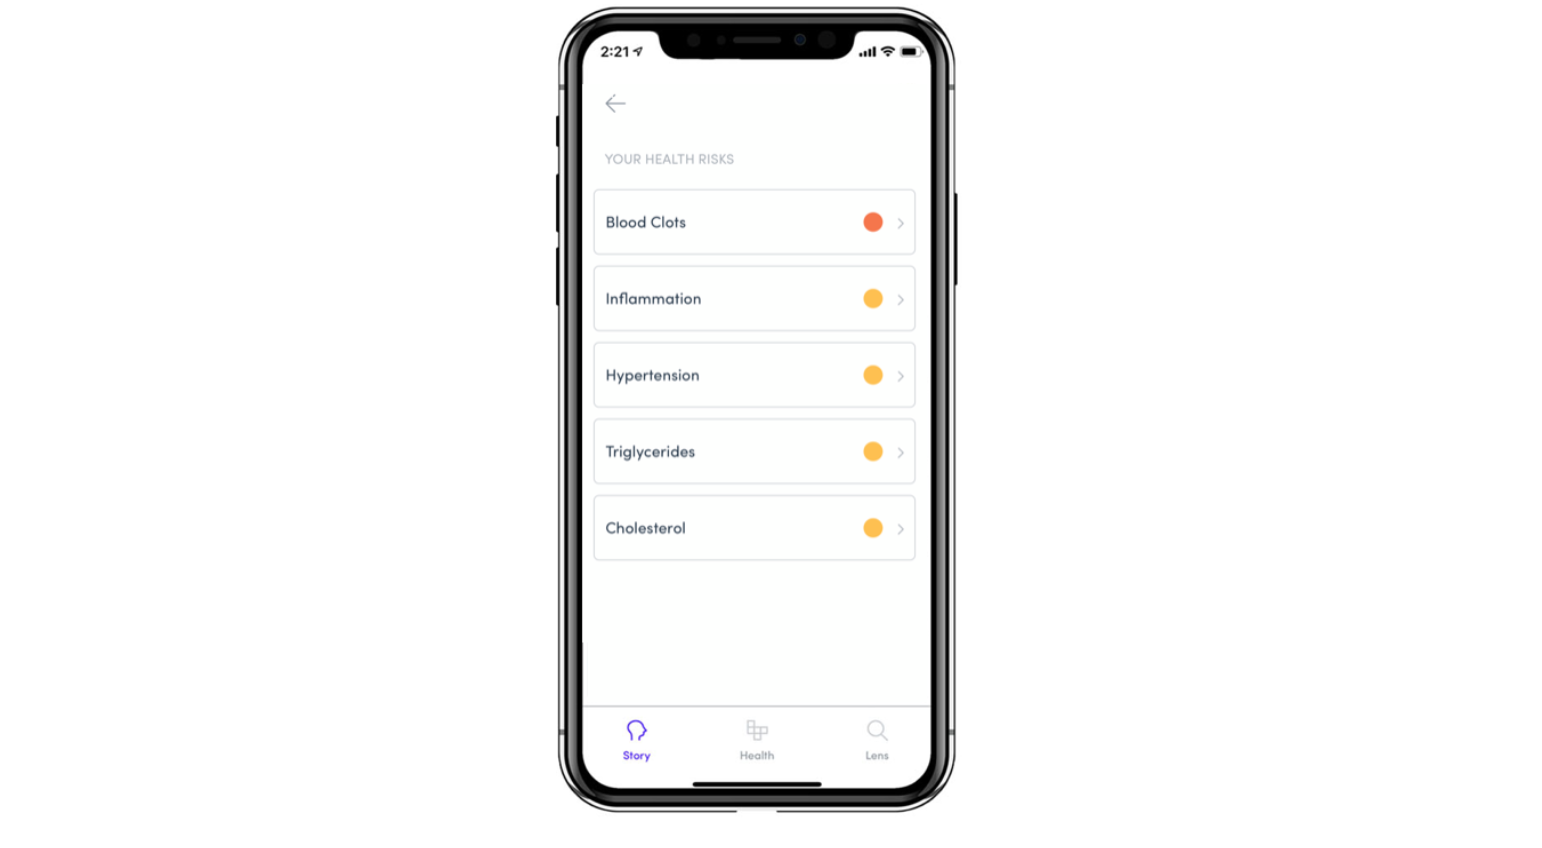
Red or yellow colour dots
The reports are organized into chapters and subchapters. For example, clicking on Heart health in stories brings you to it’s subchapters shown above. The red dot against Heart health is because of the red indicator against blood clots. The other risks are medium. What it essentially means is that there’s at least one risk gene variant that may impact a nutrient that has a role to play in blood clots. The risk is at gene-nutrient level.

What if you have a green colour dot?
This does not mean that you will never develop this condition or adverse health condition for that segment. It just signifies that from the given nutrients and genes in our model, we don’t currently see any genetic variant that may enhance your risk for the nutrient or trait impacting the condition or health segment. This may change as more research comes in and our models get updated with that research. It also doesn't mean you should ignore this health risk or the nutrients feeding into that condition. You still have to have your average population intake to be healthy.
How do Gini's models work?
Our models are set up in a couple of different ways. Vitamin D for example impacts the absorption of other nutrients because it controls anywhere between 0.5% to 5% of our gene expression. So you might see Vitamin D come up often on your nutri-gene factors list.
In some cases there might be multiple genes that is contributing to an underlying nutrigenetic risk. Our reports use multifactorial models and use the risk data from all the contributing genes to calculate if your risk is elevated, medium or the same. We’ll add more genes as research surfaces.
Interpreting sub-chapters
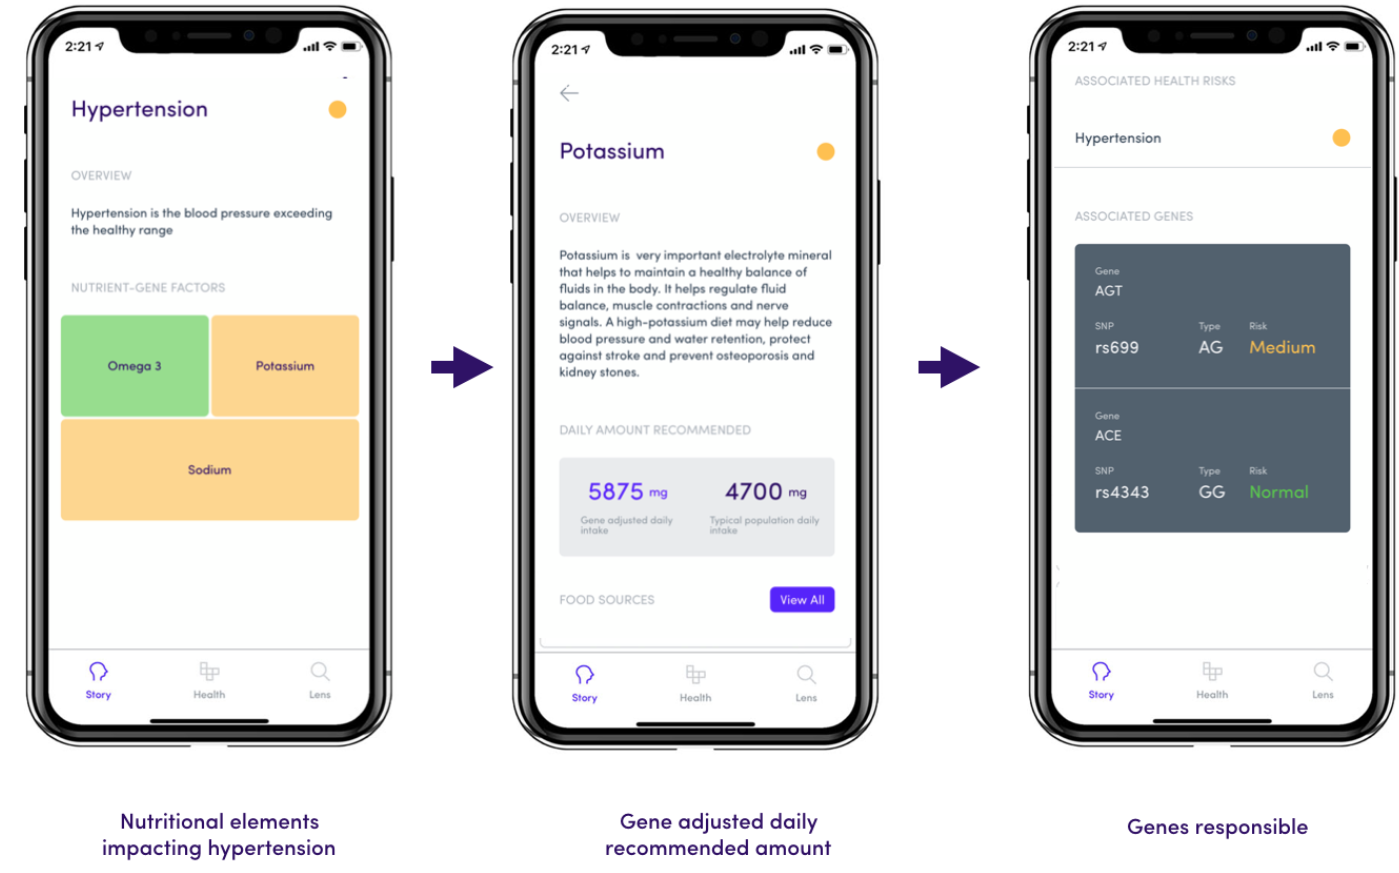
Let’s pick a medium risk element like Hypertension from one of the subchapters above. Over a billion people suffer from hypertension. Navigating to this chapter shows you a brief explanation of the condition and associated nutri-gene factors. You can see that in the report above, the person has a normal risk for Omega 3 fatty acids but not for potassium and sodium.
Digging deeper into Potassium, shows you the recommended dietary allowance and the gene adjusted value. You can see that the gene adjusted value is far above RDA recommendations. This means that the person using this report has to watch out his or her potassium intake. You can also take a look at the genes responsible for potassium absorption. We constantly update our reports based on new studies and are very transparent about what SNPs we look at. This enables you to cross validate reports if needed.
How do you take action on your reports?
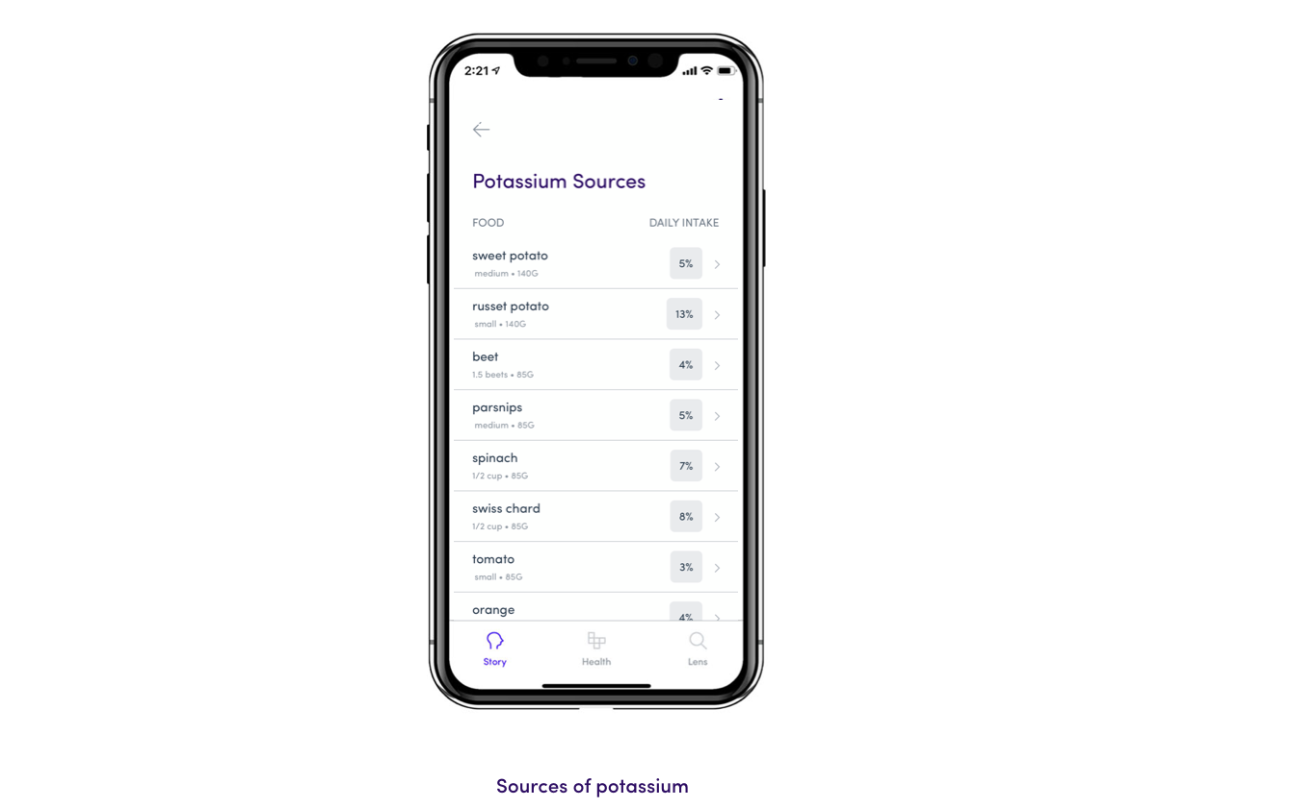
So what do you do if you know that you’re at a risk being deficient in potassium? This is where our recommendation engine comes in. Under each nutrient you’ll find sources of it along with its quantity and what percentage of your daily gene adjusted intake it covers. The idea is to enable you to consume the least amount of foods with the maximum nutritional value. Our other features like Gini lens and upcoming features like smart lists is also geared towards this. These features can help you find and curate lists of foods that you like and are rich in macro and micro nutrients that are necessary for your genetic makeup.
Hope this helps you understand and interpret your reports better.